Neuropixels
Overview
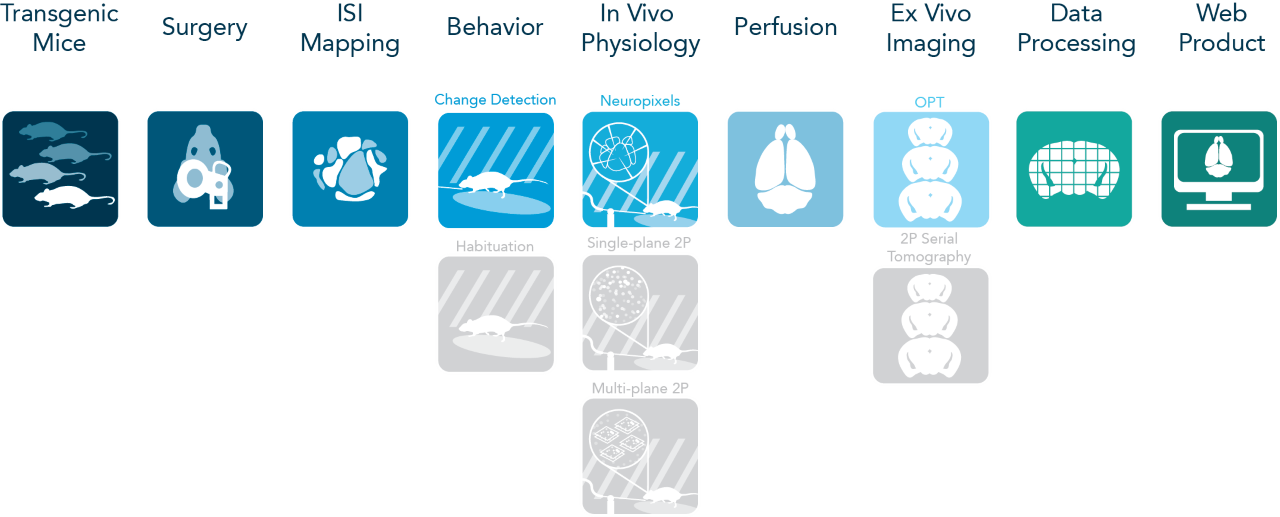
Our ability to perceive the sensory environment and flexibly interact with the world requires the coordinated action of neuronal populations distributed throughout the brain. Yet, the detailed patterns of spiking activity that underlie perception and behavior are not well understood. To further our understanding of the neural basis of behavior, the Visual Behavior project used the Allen Brain Observatory (diagrammed below) to collect a large-scale, highly standardized dataset consisting of recordings of neural activity in mice that have learned to perform a visually guided task. This dataset can be used to investigate how patterns of spiking activity across the visual cortex and thalamus are related to behavior and also how these activity dynamics are influenced by task-engagement and prior visual experience.
The Visual Behavior Neuropixels dataset includes 153 sessions from 81 mice. These data are made openly accessible, with all recorded timeseries, behavioral events, and experimental metadata conveniently packaged in Neurodata Without Borders (NWB) files that can be accessed and analyzed using our open Python software package, the AllenSDK.
Visual Change Detection Task
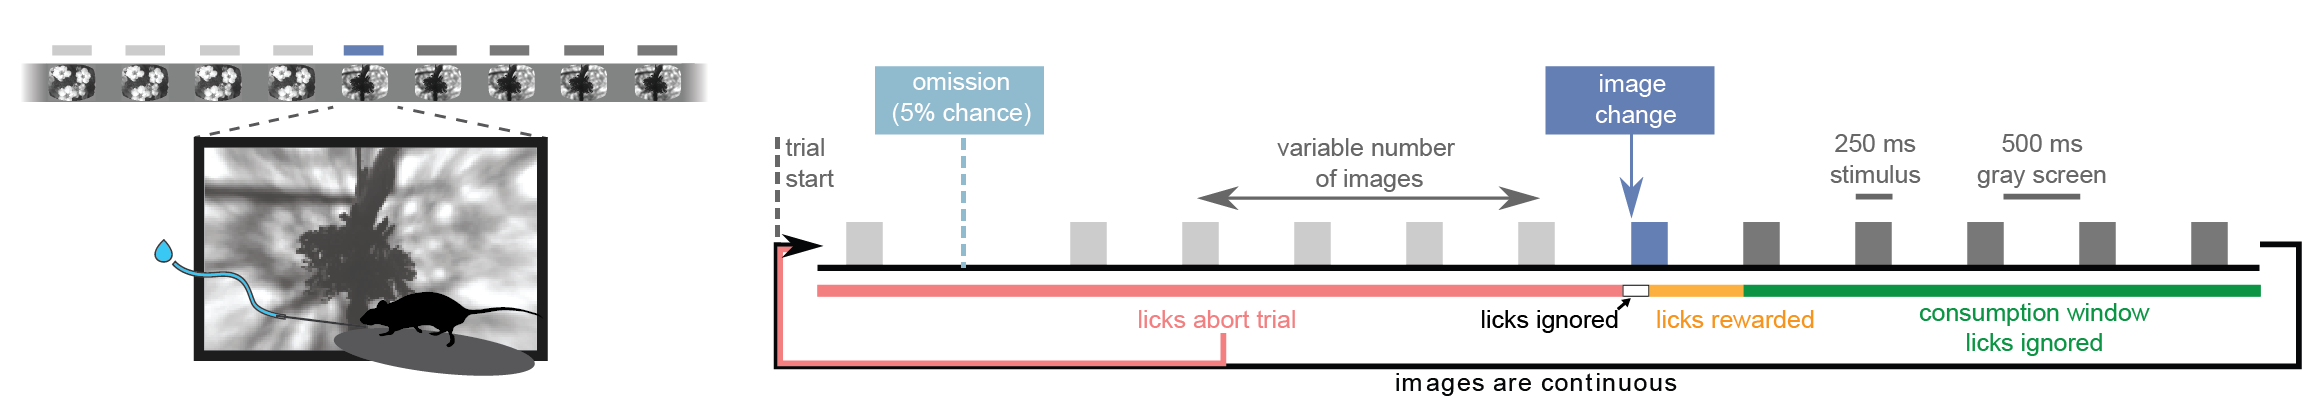
The Visual Behavior Optical Physiology and Visual Behavior Neuropixels projects are built upon a change detection behavioral task. Briefly, in this go/no-go task, mice are shown a continuous series of briefly presented visual images and they earn water rewards by correctly reporting when the identity of the image changes (diagrammed below). Five percent of images are omitted, allowing for analysis of expectation signals.
Visual Behavior Neuropixels Data
This dataset includes multi-regional Neuropixels recordings from up to 6 probes at once. The probes target six visual cortical areas including VISp, VISl, VISal, VISrl, VISam, and VISpm. In addition, multiple subcortical areas are also typically measured, including visual thalamic areas LGd and LP as well as units in the hippocampus and midbrain. Note that for the first release, NWB files will include spike times for units recorded in these structures, but LFP data will not be available.
Recordings were made in three genotypes: C57BL6J, Sst-IRES-Cre; Ai32, and Vip-IRES-Cre; Ai32. By crossing Sst and Vip lines to the Ai32 ChR2 reporter mouse, we were able to activate putative Sst+ and Vip+ cortical interneurons by stimulating the cortical surface with blue light during an optotagging protocol at the end of each session.

To relate these neurophysiological recordings to mouse behavior, the timing of behavioral responses (licks) and earned rewards were also recorded, as well as mouse running speed, eye position and pupil area.

Dataset Summary
Every experimental session consisted of four major stimulus epochs as diagrammed below: 1) an active behavior epoch during which the mouse performed the change detection task, 2) a receptive field characterization epoch during which we presented gabor stimuli and full-field flashes, 3) a passive replay epoch during which we replayed the same stimulus frame-for-frame as the mouse encountered during active behavior, but now with the lick spout removed and 4) an optotagging epoch during which we stimulated the surface of the brain with blue light to activate ChR2-expressing cortical interneurons.

To allow analysis of stimulus novelty on neural responses, two different images sets were used in the recording sessions: G and H (diagrammed below). Both image sets comprised 8 natural images. Two images were shared across the two image sets (purple in diagram), enabling within session analysis of novelty effects. Mice took one of the following three trajectories through training and the two days of recording:
1) Train on G; see G on the first recording day; see H on the second recording day
2) Train on G; see H on the first recording day; see G on the second recording day
3) Train on H; see H on the first recording day; see G on the second recording day
The numbers in the Training and Recording Workflow bubble below give the total recording sessions of each type in the dataset.

Your browser is out-of-date!
Update your browser to view this website correctly.